配置监控组件
obshell Dashboard 的性能监控和告警功能依赖 Prometheus 和 Alertmanager 工具,本文介绍如何部署所需的监控组件。
背景
使用 obshell Dashboard 的性能监控功能依赖 obagent 和 Prometheus 工具,告警功能依赖 Alertmanager 工具。obagent 提供 http 接口可以从 seekdb 中采集数据,Prometheus 根据配置定期访问 obagent 的接口采集监控数据并进行持久化存储,obshell Dashboard 提供页面展示 Prometheus 采集的监控数据。Alertmanager 处理来自 Prometheus 等监控系统的告警,并提供告警的去重、分组、路由和静默等功能。
安装 obagent
配置 seekdb
-
准备用户
建议使用一个只读用户,只赋予 oceanbase.* 的读权限。
 create user monitor identified by '******';
grant select on oceanbase.* to monitor; -
设置实例名
如需使用一个 Prometheus 监控多个 seekdb 实例,需要为每个 seekdb 实例设置不同的实例名,以便更好地区分各个 seekdb 实例。
alter system set `cluster` = 'obcluster';提示设置实例名时,必须为配置项
cluster加上反引号(`)才能执行成功。
配置 obagent
-
安装 obagent
访问 开源镜像库,根据所用环境的架构对应下载 obagent 安装包,并执行如下命令安装。建议安装最新版本。
[root@test ~]# rpm -ivh obagent-*.rpmobagent 默认安装在
/home/admin目录下。 -
配置 obagent
执行以下命令来配置采集账号密码以及一些必要的元数据信息。
[root@test ~]# cd /home/admin/obagent
[root@test obagent]# bin/ob_agentctl config --update monagent.ob.monitor.user=monitor,monagent.ob.monitor.password=******,monagent.ob.cluster.name=obcluster,monagent.pipeline.ob.status=active,agent.http.basic.auth.metricAuthEnabled=false
命令参数介绍如下:
monagent.ob.monitor.user:配置采集账号,指定为 seekdb 中创建的只读用户(本文中为monitor)。monagent.ob.monitor.password:配置采集账号的密码,指定为 seekdb 中只读用户的密码。monagent.ob.cluster.name:seekdb 实例的实例名,可连接实例后执行SHOW PARAMETERS LIKE 'cluster';命令查看,value列的值即为实例名。monagent.pipeline.ob.status:配置为active表示开启 seekdb 相关指标的采集。agent.http.basic.auth.metricAuthEnabled:配置为false表示关闭 obagent http 接口的 basic auth 认证。
命令执行输出如下:
{"successful":true,"message":"success","error":""} -
启动 obagent
[root@test obagent]# bin/ob_agentctl start命令执行输出如下:
{"successful":true,"message":"ok","error":""}
验证
您可通过进程确认是否成功启动 obagent,也可访问数据查询接口验证是否可以获取监控数据。
-
查看进程
[root@test obagent]# ps -ef | grep agent输出如下:
root     27064     1  0 14:46 ?        00:00:00 /home/admin/obagent/bin/ob_agentd -c /home/admin/obagent/conf/agentd.yaml
root     27071 27064  0 14:46 ?        00:00:00 /home/admin/obagent/bin/ob_mgragent
root     27072 27064  0 14:46 ?        00:00:00 /home/admin/obagent/bin/ob_monagent
root 27116 26122 0 14:47 pts/0 00:00:00 grep --color=auto agent -
访问数据查询接口
[root@test obagent]# curl -L 'http://127.0.0.1:8088/metrics/ob/basic'输出如下:
# HELP ob_active_session_num monitor collected message
# TYPE ob_active_session_num untyped
ob_active_session_num{app="OB",ob_cluster_id="0",ob_cluster_name="obcluster",ob_tenant_id="1",obzone="",svr_ip="127.0.0.1",svr_port="2882",tenant_name="sys"} 0 1762135926015
# HELP ob_all_session_num monitor collected message
# TYPE ob_all_session_num untyped
ob_all_session_num{app="OB",ob_cluster_id="0",ob_cluster_name="obcluster",ob_tenant_id="1",obzone="",svr_ip="127.0.0.1",svr_port="2882",tenant_name="sys"} 0 1762135926015
# HELP ob_plan_cache_access_total monitor collected message
# TYPE ob_plan_cache_access_total untyped
ob_plan_cache_access_total{app="OB",ob_cluster_id="0",ob_cluster_name="obcluster",ob_tenant_id="1",obzone="",svr_ip="127.0.0.1",svr_port="2882",tenant_name="sys"} 33229 1762135926015
# HELP ob_plan_cache_hit_total monitor collected message
# TYPE ob_plan_cache_hit_total untyped
ob_plan_cache_hit_total{app="OB",ob_cluster_id="0",ob_cluster_name="obcluster",ob_tenant_id="1",obzone="",svr_ip="127.0.0.1",svr_port="2882",tenant_name="sys"} 32051 1762135926015
# HELP ob_plan_cache_memory_bytes monitor collected message
# TYPE ob_plan_cache_memory_bytes untyped
ob_plan_cache_memory_bytes{app="OB",ob_cluster_id="0",ob_cluster_name="obcluster",ob_tenant_id="1",obzone="",svr_ip="127.0.0.1",svr_port="2882",tenant_name="sys"} 1.15905078e+08 1762135926015
# HELP ob_server_num monitor collected message
# TYPE ob_server_num untyped
ob_server_num{app="OB",ob_cluster_id="0",ob_cluster_name="obcluster",obzone="",server_ips="127.0.0.1",status="ACTIVE",svr_ip="127.0.0.1",svr_port="2882"} 1 1762135926015
# HELP ob_sysstat monitor collected message
# TYPE ob_sysstat untyped
ob_sysstat{app="OB",ob_cluster_id="0",ob_cluster_name="obcluster",ob_tenant_id="1",obzone="",stat_id="10000",svr_ip="127.0.0.1",svr_port="2882",tenant_name="sys"} 2673 1762135926015
ob_sysstat{app="OB",ob_cluster_id="0",ob_cluster_name="obcluster",ob_tenant_id="1",obzone="",stat_id="10001",svr_ip="127.0.0.1",svr_port="2882",tenant_name="sys"} 2.838626e+06 1762135926015
······# 省略后续输出
配置 Prometheus
可访问 Prometheus 官网 或 开源镜像�库,根据所用环境的架构下载对应的安装包部署 Prometheus。一般仅需要一个 Prometheus 实例即可监控所有的 seekdb 实例。本节提供配置示例仅供参考,具体安装及配置介绍可参见 Prometheus 官网文档。
可访问 obd GitHub 仓库 查看 OceanBase 提供的 Prometheus 告警规则文件。
global:
  scrape_interval: 5s # Set the scrape interval to every 15 seconds. Default is every 1 minute.
  evaluation_interval: 5s # Evaluate rules every 15 seconds. The default is every 1 minute.

# Alertmanager configuration, prometheus will push alerts to these addresses
alerting:
  alertmanagers:
    - static_configs:
      - targets:
        - localhost:9093

# Load rules once and periodically evaluate them according to the global 'evaluation_interval'.
rule_files:
  - "prometheus_rules.yaml"
  # - "second_rules.yml"


scrape_configs:
  - job_name: "ob-basic"
    metrics_path: "/metrics/ob/basic"
    # prometheus 3.x 版本需要打开下面的配置
    # fallback_scrape_protocol: PrometheusText0.0.4
    static_configs:
      - targets: ["127.0.0.1:8088"]
  - job_name: "ob-extra"
    metrics_path: "/metrics/ob/extra"
    # prometheus 3.x 版本需要打开下面的配置
    # fallback_scrape_protocol: PrometheusText0.0.4
    static_configs:
      - targets: ["127.0.0.1:8088"]
  - job_name: "ob-host"
    metrics_path: "/metrics/node/host"
    # prometheus 3.x 版本需要打开下面的配置
    # fallback_scrape_protocol: PrometheusText0.0.4
    static_configs:
      - targets: ["127.0.0.1:8088"]
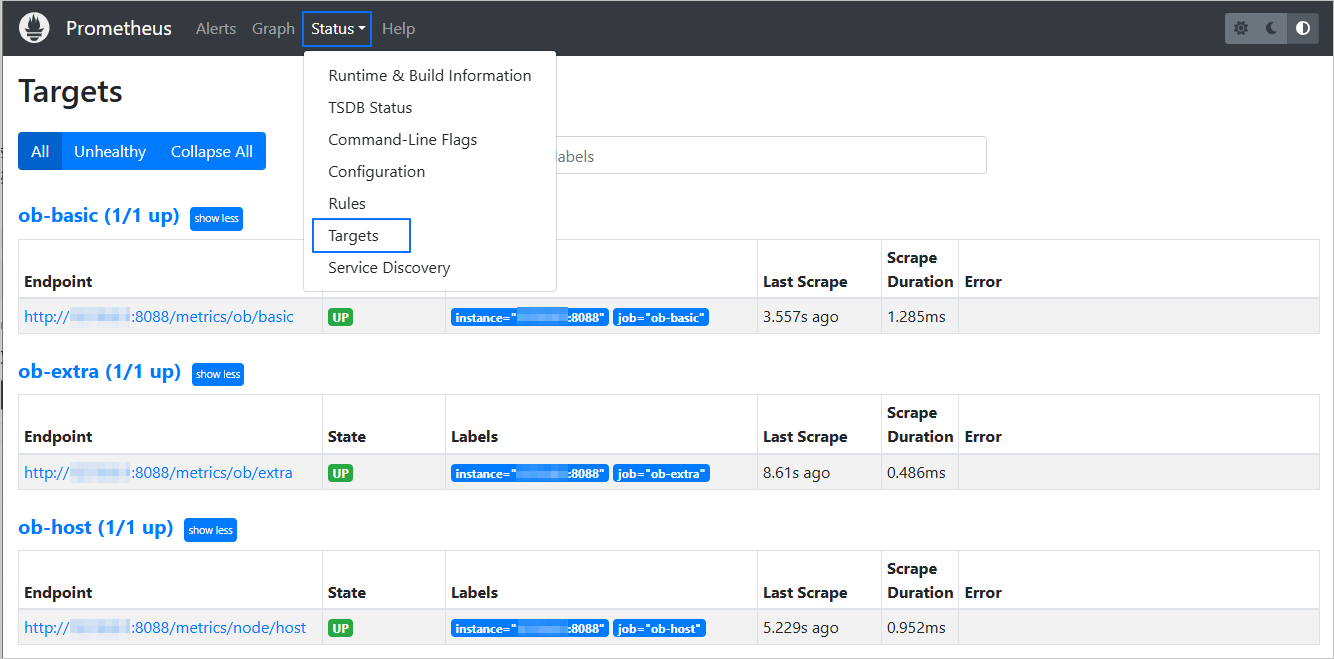
配置 Prometheus 之后,可访问 Prometheus 图形化界面,单击 Status 后选择 Target,查看采集是否正常。
不同版本的 Prometheus 页面界面词不同,此处 Target 字段仅是示例。
配置 Alertmanager
访问 Prometheus 官网 或 开源镜像库,根据所用环境的架构对应下载并解压所需安装包。参考 Alertmanager 文档 介绍修改配置文件(alertmanager.yml),完成后进入工作目录执行如下命令启动 Alertmanager。
[root@test alertmanager]# nohup ./alertmanager --config.file=alertmanager.yml --cluster.advertise-address=127.0.0.1:9093 > alertmanager.log 2>&1 &
示例中 127.0.0.1:9093 表示服务地址,nuohup 表示将 alertmanager 进程放到后台运行。