Performance monitoring
Log in to the obshell Dashboard console and click Performance monitoring in the left-side navigation pane. On the Performance monitoring page, you can view the icons of the performance metrics of seekdb.
When you log in for the first time, you must enter the address, username, and password of Prometheus. If you have not installed Prometheus, we recommend that you install it by following the instructions in Configure monitoring components.
The Performance monitoring page provides real-time monitoring capabilities for the Performance and SQL, Transaction, Storage and Cache, and Host performance metrics of a seekdb instance. This helps you quickly locate performance bottlenecks and optimize system resource usage.
By default, the Performance monitoring page displays the monitoring information of the Performance and SQL tab. Different tabs support viewing different monitoring metrics, as shown in the following table.
| Tab | Monitoring metrics |
|---|---|
| Performance and SQL | This tab displays the following performance metrics: QPS, Response time, SQL execution plan category, SQL execution plan time, Number of sessions, Waiting for events, Waiting for event time, Request waiting queue, Request waiting queue time consuming, CPU cost, Thread usage, memory usage percent, MemStore usage percent, Cursors, and GTS request count. |
| Transaction | This tab displays the following performance metrics: TPS, Transaction response time, Transaction response time detail, Transaction rollback ratio, Number of transaction logs, Transaction log volume, Transaction log time-consuming, Number of transaction lock waits, Average time to wait for transaction lock, Transaction count, and MemStore lock success ratio. |
| Storage and Cache | This tab displays the following performance metrics: MemStore, IOPS, IO time-consuming, I/O Throughput, Cache size, Cache hit rate, Cache request total count, Log Disk, Log Disk Percentage, Vector Memory, and Vector Memory Percentage. |
| Host performance | This tab displays the following performance metrics: Linux system load, CPU Usage, Memory, Memory usage, IOPS, IO time-consuming, I/O Throughput, and Network Throughput Rate. |
Procedure
-
You can customize the refresh frequency and time range at the top of the page based on your needs.

-
By default, performance data does not refresh. Click the refresh button next to Performance monitoring to refresh the entire Performance monitoring page and display the Performance and SQL module. Click the refresh field to refresh the icon information and remain in the current module.
-
You can customize the refresh frequency. Hover the cursor over the Close field to select the refresh frequency from the drop-down list. The refresh frequency options are
Off,5s,10s, and30s, withOffas the default. -
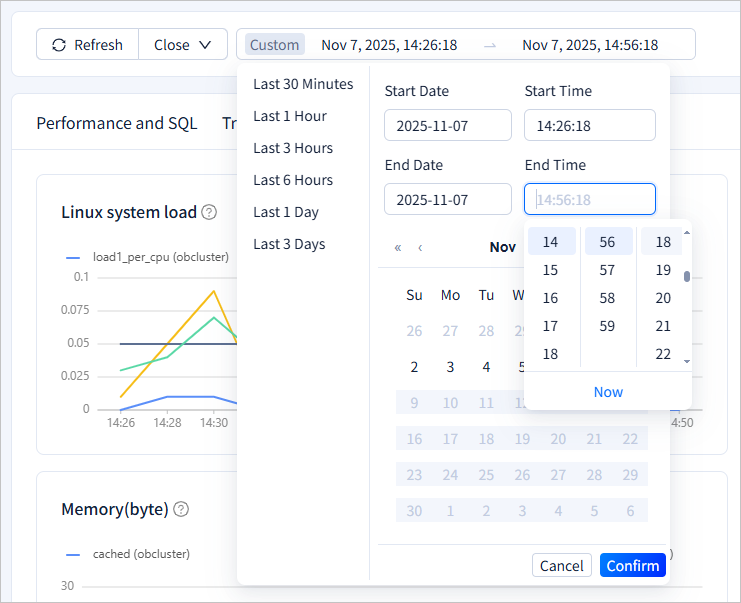
You can use the time selector to customize the monitoring scope. Click the left side to select monitoring information for a specific period before the current time. For example, click Last 30 Minutes to view monitoring information for the last 30 minutes. By default, the last 1 hour of data is displayed. You can select a different period as needed. The right side displays the date and time. You can manually enter the date or select it from the calendar below. You can manually enter the time or select it by sliding the mouse.
-
-
Hover the cursor over the question mark icon next to each monitoring item to view its description. Hover the cursor over any position on the monitoring chart to view the detailed information of the line chart. Click ▲ or ▼ in the upper-right corner of the icon to navigate to the previous or next page.

-
You can perform operations on specific monitoring metrics.
Hover the cursor over the corresponding monitoring metric to display the
 icon. Click this icon to display only the line trend of this monitoring metric, and the other colored line trends will be grayed out. Click the icon again to display all monitoring metrics.
Click the red box in the following figure to hide the corresponding colored line trend, which will be grayed out. Click the box again to display the corresponding colored line trend.
